MID BA: Graph Durations
This tool will help you determine the time spent on the models by calculating statistics about the model and the nodes within it.
You will see the total number of times the model has been opened, and the average amount of time the model takes to complete.
You will also see a chart displaying two metrics for each node.
- Average percentage of time the node takes per case.
- Number of cases each node has appeared in.
The aim of this tool is to help you identify where bottle necks are occurring.
The two metrics explained:
“Avg. % time spent per case”
This is the average percentage of time that a node takes per case over all cases that node has appeared in. So, in other words, if a node is costing your end users a lot of time, this value will be higher than the other nodes.
“Number of cases used in”
This metric is essential for qualifying a problem exposed by the previous metric - if the node has only been used in a few cases, then the average time is irrelevant, or at least not urgent.
Use case:
Here’s an example of the demo NDA model
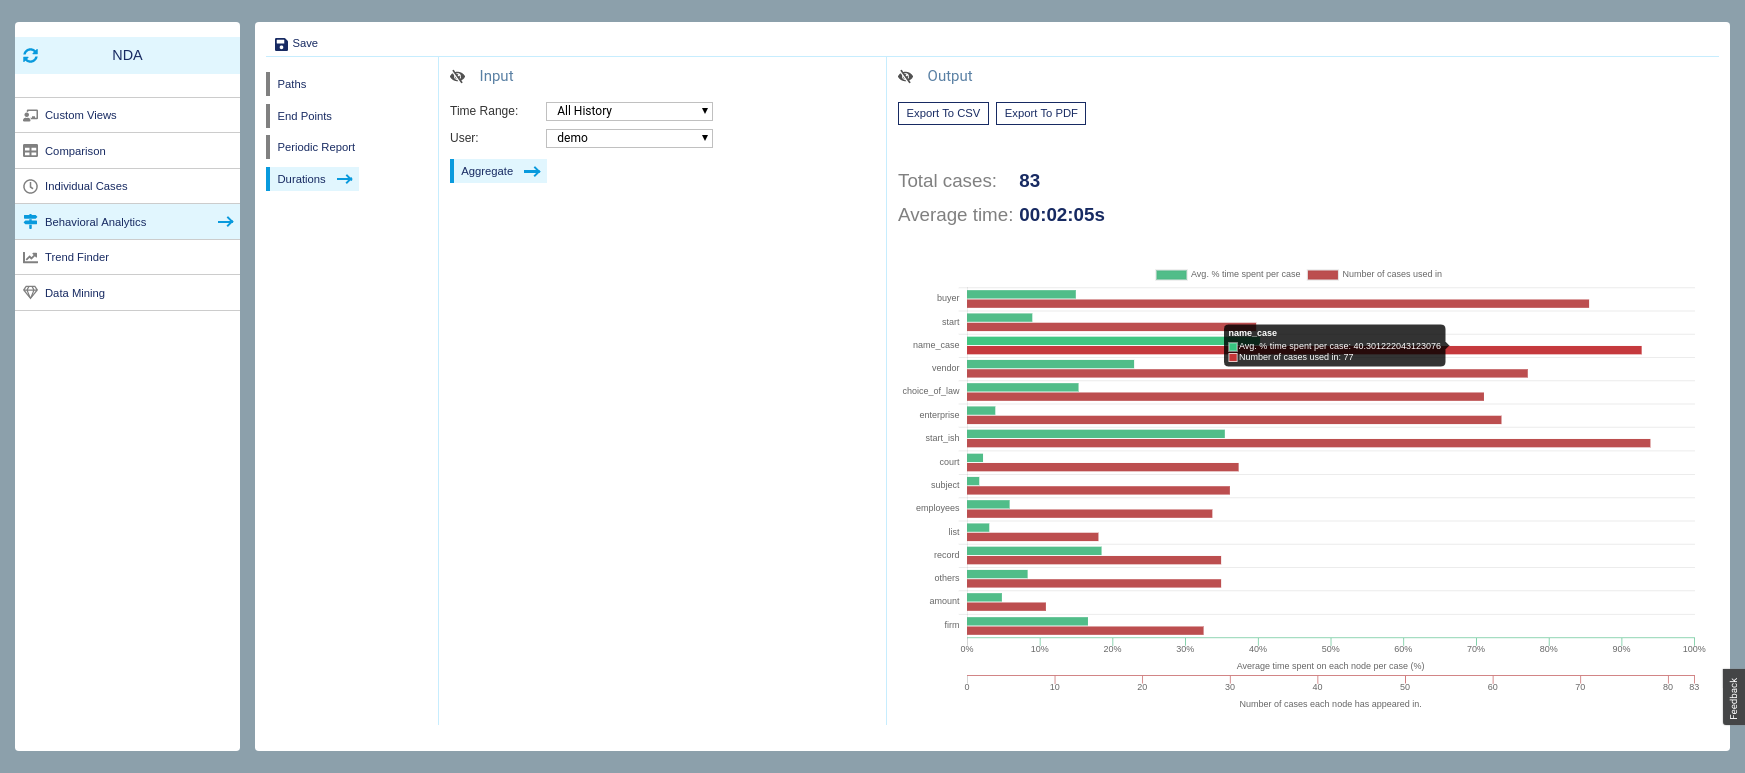
It’s clear to look at that there is a bottle neck in the node named “name_case” - which in this model is a node with a single question asking the end user to give a name for the case.
It turned out that people were struggling to come up with a good name.
After removing that node, we reduced the time cost on the model, thereby optimising it.